The End of the UNFCCC /IPCC Global Warming Meme.
1.The Millennial Global Temperature Cycle.
Planetary orbital and solar activity cycles interact and combine to drive global temperatures. Because of the thermal inertia of the oceans there is a 12+/- year delay between these drivers and global temperature. The amount of CO2 in the atmosphere is 0.058% by weight. It is inconceivable thermodynamically that such a tiny tail could wag so big a dog. The Oulu galactic cosmic ray count provides a useful proxy for driver amplitude.
The statements below are supported by the Data, Links and Reference in parentheses ( ) at https://climatesense-norpag.blogspot.com/2021/08/c02-solar-activity-and-temperature.html
A Millennial Solar Activity Turning Point (MSATP) was reached in 1991/2. The correlative temperature peak and Millennial Temperature Turning Point (MTTP ) was in 2003/4 as also reported in Nature Climate Change | VOL 12 | April 2022 | 380–385 | www.nature.com/natureclimatechange :Tang et al Increasing terrestrial ecosystem carbon release in response to autumn cooling and warming.
Because of the thermal inertia of the oceans the UAH 6.0 satellite Temperature Lower Troposphere anomaly was seen at 2003/12 (one Schwab cycle delay) The Northern Hemisphere temperature anomaly peaked at 2003/12 at 0.37.There has been no net NH warming for 18 years. Earth passed the peak of a natural Millennial temperature cycle trend in 2004 and will generally cool until 2680 – 2700.

a, Trends in autumn (September–November) temperature during 1982–2003. b, Trends in autumn temperature during 2004–2018. c, Trends in mean autumn temperature anomalies during both periods. The air temperature data were obtained from the CRU Time Series 4.0. The black line in c indicates the mean autumn temperature over the whole region north of 25° N (NH), and the blue and red lines indicate the average autumn temperature over the CAs and WAs, respectively. *P < 0.1; **P < 0.05; ***P < 0.01. The black line in b represents the extent of the cooling areas. Maps in a,b were generated using ArcGIS (version 10.7). Copyright © 1995–2019 Esri.
Short term deviations from the Millennial trends are driven by ENSO events and volcanic activity.

Fig 2 Correlation of the last 5 Oulu neutron cycles and trends with the Hadsst3 temperature trends and the 300 mb Specific Humidity. (28,29)
The Oulu Cosmic Ray count shows the decrease in solar activity since the 1991/92 Millennial Solar Activity Turning Point and peak There is a significant secular drop to a lower solar activity base level post 2007+/- and a new solar activity minimum late in 2009.The MSATP at 1991/2 correlates with the MTTP at 2003/4 with a 12/13 +/- year delay. In Figure 2(5) short term temperature spikes are colored orange and are closely correlated to El Ninos. The hadsst3gl temperature anomaly at 2037 is forecast to be + 0.05.
2.Arctic Sea Ice Trends.
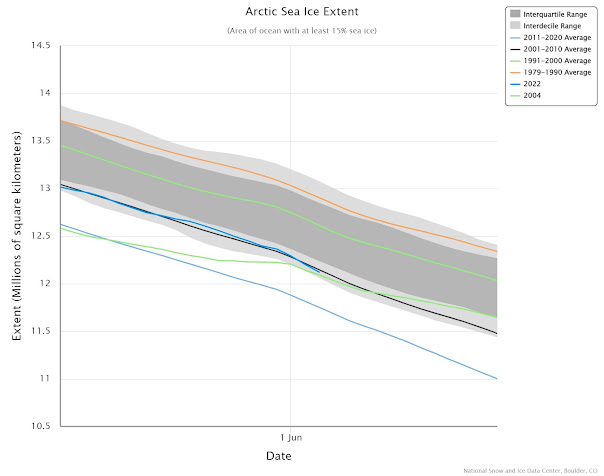
Fig. 3 Mean Sea Ice Extents 1979 - 2020 and years 2022 and 2004.


4. Sea Level.

It can now be plausibly conjectured that a Millennial sea level peak will follow the Millennial solar activity peak at 1991/92 . This may occur at a delay of one half of the fundamental 60 year cycle i.e at 2021/22. see Fairbridge and Sanders 1987 (18).The rate of increase in sea level from 1990 - present was 3.3 millimeters/year. The net rate of increase from Sept 13th 2019 to Jan 13/ 2022 in Figure 5 was 2.3mm/year. A possible Sea Level Peak and Turning Point may have been reached at Jan 13 2022 with an anomaly of 102.2 mm. Sea level fell to 100.8 mm by Feb 21st 2022.
The conjecture will be strengthened if the fall continues for the rest of the year as is suggested by the Southern Oscillation Index (SOI) May 2022

Fig.6 30 Day moving SOI
Sustained positive values of the SOI above +7 typically indicate La Niña (cooling) while sustained negative values below −7 typically indicate El Niño.(warming) Values between +7 and −7 generally indicate neutral conditions. Values at May 01 2022 indicate a possible strong La Nina in Sept/Oct this year leading to cooling. Conversely ,the solar activity of cycle 25 is increasing towards a 2024/5 peak with possible warming - Fig.2 D. We will see which trend dominates the fall 2022 sea ice minimum. http://www.bom.gov.au/climate/enso/#tabs=Pacific-Ocean&pacific=SOI
5. Basic Science Summary.
The anthropogenic CO2 Radiative Forcing concept on which the climate models’ dangerous warming forecasts are based is inappropriate for analyzing atmospheric temperature changes. Solar sourced energy flows in and out of the Inter Tropical Convergence Zone provide the net negative feedback which has kept the earth within a narrow temperature range for the last 600 million years. The effects on temperature and climate of major meteorite strikes, periods of flood basalt outpourings , major volcanic eruptions and ENSO events are superposed on this solar sourced background.
Most importantly the models make the fundamental error of ignoring the long- term decline in solar activity and temperature which will follow the Millennial Solar Activity Turning Point and activity peak which was reached in 1990/91 as shown in Figure 2. above. The UNFCCC Renewable Energy Targets in turn are based on model forecast outcomes which now appear disconnected from any possible reality.
The global temperature cooling trends from 2003/4 – 2704 are likely to be broadly similar to those seen from 996 – 1700+/- (Fig3,23,24 ) From time to time the jet stream will swing more sharply North – South. Local weather in the Northern Hemisphere in particular will be generally more variable with, in summers more northerly extreme heat waves, droughts and floods and in winter more early fall and late spring frosts.
6. Energy Sources, Population Demographics and Sustainability.
Modern industrial civilization, especially in large Megacities, cannot function for long without continuous adequate power supply, and functional global food and basic resource supply chains. The 2021 Texas freeze killed about 200 people. Long lines for food and water provided a red-flag warning of the present dangers of a cooling world. The war in Ukraine has given us a preview of future trends which were already underway. After only a few months of war nations are forced to abandon their rapid move away from fossil fuels. Food insecurity, starvation, global poverty and income disparity increases threaten the UN’s Sustainable Development Goals. Cross border migration is out of control across the Rio Grande into the USA, and from West Africa via Libya to Europe and across the English channel. Loss of wildlife habitat to human habitation, cattle-ranching and ocean overfishing have accelerated species extinctions worldwide. Agricultural monocultures based on chemical fertilizer and insecticides have already decimated bird populations in the northern hemisphere. Rosenberg et al 2019 in "Decline of the North American Avifauna" (39) says: "Integration of range-wide population trajectories and size estimates indicates a net loss approaching 3 billion birds, or 29% of 1970 abundance ...Steep declines in North American bird populations parallel patterns of avian declines emerging globally.”
The UNEP, IPCC and UNFCCC “consensus” scientific community’s unwarranted focus on future CO2 levels, and global warming mitigation via “net zero” energy policies has been adopted by most Governments, Mainstream Media, NGOs and leading politicians as the basis for climate and energy policy. Individual Governments will now decide where and how, given their different political systems and demographics, they will draw the line between accommodation for other species and natural ecosystems and food supply costs, poverty reduction, economic development and consumer consumption levels.
Humanity contends with all other species including COVID 19 and its variants in a Darwinian struggle for lebensraum. During the last major influenza epidemic world population was 1.9 billion. It is now 7.8 billion+/. The establishment science “consensus" that a modelled future increase in CO2 levels and not this actual fourfold population increase is the main threat to civilization has no empirical basis. The cost of the proposed rapid transition to non- fossil fuels would create an unnecessary, enormously expensive. obstacle in the way of the effort to attain a modern ecologically viable sustainable global economy. We must adapt to the most likely future changes and build back smarter when losses occur.
Very interesting article. I am not a geologist (my parents were) but as a physicist I concur with your hypothesis/theory.
ReplyDeleteThanks - please share the Post using your own name if you can. Norman
DeleteThis is the best coverage of the AGC issue that I have found in the decades that I have been educating myself on this important topic.
ReplyDeleteI'd like to donate, but when I tried to do so I got a notice that Dr. Page is not eligible to receive donations! Who is the culprit for this mistreatment?
Marshal ,thanks for your kind comments.The problem is with my pay pal account which was hacked and had money stolen. I'mreluctant to re-open it.Feel free to put a check in the mail .
Delete12451 Queensbury Lane Houston Tex 77024
Marshal Many thanks for your most generous contibution which arrived today 11/23. I'm close to finishing my latest update paper which deals with AI-which inherently doesn't lead to any new science.I am going to submit it to Nature Climate Science but doubt that they will publish it Best regards Norman
Delete