The Solar Activity - Global Cooling Trackers - April. 2022

Fig.1.Correlation of the last 5 Oulu neutron count Schwab cycles and trends with the Hadsst3 temperature trends and the 300 mb Specific Humidity. (28,29) see References in parentheses ( ) at https://climatesense-norpag.blogspot.com/2021/08/c02-solar-activity-and-temperature.html
The Millennial Solar Activity Turning Point and Activity Peak was reached in 1991. Earth passed the peak of a natural Millennial temperature cycle in the first decade of the 21st century and will generally cool until 2680 – 2700.
Because of the thermal inertia of the oceans the correlative UAH 6.0 satellite Temperature Lower Troposphere anomaly was seen at 2003/12 (one Schwab cycle delay) and was + 0.26C.(34) The temperature anomaly at 2022/03 was +0.26C (34).There been no net global warming for the last 20 years. The Oulu Cosmic Ray count shows the decrease in solar activity since the 1991/92 Millennial Solar Activity Turning Point and peak There is a significant secular drop to a lower solar activity base level post 2007+/- and a new solar activity minimum late in 2009.The MSATP at 1991 correlates with the MTTP at 2003/4 with a 12/13 +/- year delay. In Figure 1(5) short term temperature spikes are colored orange and are closely correlated to El Ninos. The had sst3gl temperature anomaly at 2037 is forecast to be + 0.05.
2. Arctic Sea Ice.
Arctic sea ice reached its maximum extent for the year, at 14.88 million square kilometers (5.75 million square miles) on February 25. The 2022 maximum was the tenth lowest in the 44-year record.

Fig.2 Arctic Sea Extent (NSIDC)

3.Arctic Sea ice volume.
Average Arctic sea ice volume in April 2022 was 23,000 km3. This value is the 9th lowest on record for April, about 2,300 km^3 above the record set in 2017.
See Data at: http://psc.apl.uw.edu/research/projects/arctic-sea-ice-volume-anomaly/#:~:text=February%202022%20Monthly%20Update,mean%20value%20for%201979%2D2021.
4.Sea Level
It can now be plausibly conjectured that a Millennial sea level peak will follow the Millennial solar activity peak at 1991/92 . This may occur at a delay if one half of the fundamental 60 year cycle i.e at 2021/22. Fairbridge and Sanders 1987 (18).The rate of increase in sea level from 1990 - present was 3.4 millimeters/year. The net rate of increase from Sept 13th 2019 to Jan. 03 2022 in Figure 3 was 2.3mm/year. If sea level begins to fall by end 2022 the conjecture will be strengthened.
5. Solar Activity Driver and Near term Temperatures
An indicator of temperatures for 5 - 6 months ahead is provided by the SOI graph.

Fig.4 30 Day moving SOI
Sustained positive values of the SOI above +7 typically indicate La Niña (cooling) while sustained negative values below −7 typically indicate El Niño.(warming) Values between +7 and −7 generally indicate neutral conditions. Values at May 01 2022 indicate a possible strong La Nina in Sept/Oct this year leading to cooling. Conversely , the solar activity of cycle 25 is increasing towards a 2024/5 peak with possible warming. We will see which trend dominates September's sea ice extension and volume minima.
http://www.bom.gov.au/climate/enso/#tabs=Pacific-Ocean&pacific=SOI
Basic Science Summary
The global temperature cooling trends from 2003/4 – 2700 are likely broadly similar to or probably somewhat colder than those seen from 996 – 1700+/- in Figure 5.(.3) From time to time the jet stream will swing more sharply North – South. Local weather in the Northern Hemisphere in particular will be generally more variable with, in summers occasional more northerly extreme heat waves, droughts and floods and in winter more southerly unusually cold snaps and late spring frosts.
The IPCC -UNFCCC "establishment" scientists deluded first themselves, then politicians, governments, the politically correct chattering classes and almost the entire UK and US media into believing that anthropogenic CO2 and not the natural Millennial solar activity cycle was the main climate driver. This led governments to introduce policies which have wasted trillions of dollars in an unnecessary and inherently futile attempt to control earth's temperature by reducing CO2.
Forecasts will be updated here as appropriate. To review the detailed data and the references on which this cooling paradigm is based see the links below:
A : http://climatesense-norpag.blogspot.com/2021/08/c02-solar-activity-and-temperature.html
Net Zero Threatens Sustainable development Goals. see References in parentheses ( )
B : http://www.ijaos.org/article/298/10.11648.j.ijaos.20210502.12 The Impact of CO2,H2O and other Greenhouse Gases on Equilibrium Earth Temperatures
C : https://arxiv.org/pdf/2006.03098.pdf Dependence of Earth’s Thermal Radiation on Five Most Abundant Greenhouse Gases
Solar "activity" Cycles.
Earth’s climate is the result of resonances and beats between the phases of cyclic processes of varying wavelengths and amplitudes. At all scales, including the scale of the solar planetary system, sub-sets of oscillating systems develop synchronous behaviors which then produce changing patterns of periodicities in time and space in the emergent temperature data.
Solar " activity" is the main driver of global temperatures at Millennial scales. The Oulu Galactic Ray Count number integrates changes in Solar Magnetic field strength, Total Solar Insolation , Extreme Ultra Violet radiation, Interplanetary Magnetic Field strength, Solar Wind density and velocity, Coronal Mass Ejections, proton events, and the geomagnetic Bz sign. Changes in the GCR neutron count ("solar activity marker) then modulate cloud cover and thus albedo. (Iris effect)
The periodicities pertinent to current estimates of future global temperature change fall into two main categories:
a) The orbital long wave Milankovitch eccentricity, obliquity and precession cycles. These control the glacial and interglacial periodicities and the amplitudes of the corresponding global temperature cycles.
b) Solar activity cycles with multi-millennial, millennial, centennial and decadal time scales.
The most prominent solar activity/temperature cycles are : Schwab-11+/-years ; Hale-22 +/-years ; 3 x the Jupiter/Saturn lap cycle 60 years +/- :Gleissberg 88+/- ; de Vries - 210 years+/-; Millennial- 960-1020 +/-;
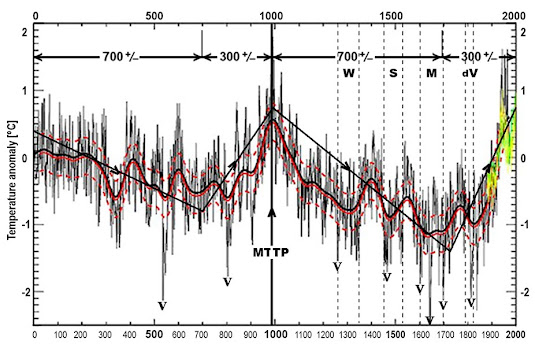
Fig.5 (Fig 3) Northern Hemisphere 2000 year temperature reconstruction and a Millennial Temperature Turning Point. (MTTP). (23,24)
Because of the data quality, record length and methods used, the NH Christiansen et al 2012 series was selected as the "type reconstruction" to represent the NH trends. (22) The de Vries, Maunder, Sporer and Wolf minima are noted. Important volcanic cooling events are marked with a V. An MTTP occurs at about 990. The Millennial cycles are asymmetric with a 700+/- year down-leg and a 300 +/- year up-leg.
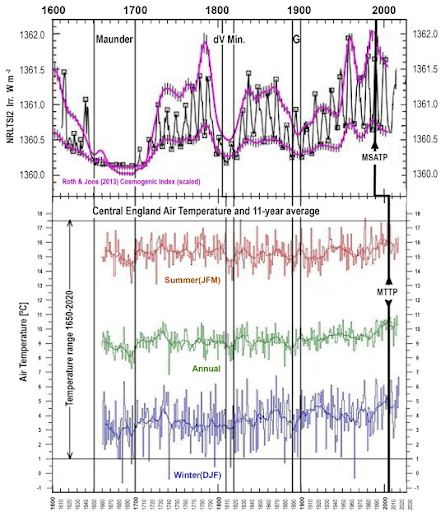
Fig 6 (Fig.4) The NRLTSI2 Solar Activity - CET Relationship 1600- Present (25,26,27)
In Fig.6 the Roth & Joos Cosmogenic Index (CI) is used as the emergent proxy for the solar activity driver of the resulting emergent global and NH temperature data.
The CI designation here integrates changes in solar magnetic field strength, TSI, EUV, IMF, Solar wind density and velocity, CMEs, proton events, the BZ sign and changes in the GCR neutron count which modulates cloud cover and thus albedo.
The effect on observed emergent behaviors i.e. global temperature trends, of the combined effect of these solar and GCR drivers will vary non-linearly depending on the particular phases of the eccentricity, obliquity and precession orbital cycles at any particular time.
Figure 6 (4) shows an increase in CI of about 2 W/m 2 from the Maunder minimum to the 1991 activity peak. This increase, together with the other solar "activity" variations modulate the earth’s temperature and albedo via the GR flux and varying cloud cover.
The emergent temperature time series trends of the combined orbital, solar and GCR drivers also reflect turning points, changes of state and important threshold effects created by the interactions of the underlying physical processes. These exogenous forcings are also simultaneously modulated by changes in the earth’s magnetic field and length of day.
The temperature increase since the 1680s is due to the up- leg in the natural solar " activity" Millennial cycle as shown by Lean 2018 "Estimating Solar Irradiance Since 850 AD" (ibid). Figure 6 (4) also shows the correlation between the CI driver and the Central England Seasonal Temperatures. (27). The 1650 – 1700 (Maunder), 1810 - 20 (de Vries/Dalton), and the 1890-1900 (Gleissberg) minima are obvious. The Millennial Solar Activity Turning Point (MSATP) at 1991 correlates with the Millennial Temperature Turning Point (MTTP) at 2003/4 with a 12/13 +/- year delay because of the thermal inertia of the oceans.
The CET in Figure 6 (4)shows that this up-leg in the CET has an annual absolute temperature Millennial cycle amplitude of at least 16.5 +/- degrees C. Using the Millennial cycle lengths of Figure 5 (3) at least that same amount of future cooling from the 2004 high is probable by the winters of 2,680-2700 +/-. These temperature changes correlate very well with the changes in energy flow from the sun shown in Figure 7 C (5) without any measurable effect of C02 levels.
Fig 7 (5) Correlation of the last 5 Oulu neutron count Schwab cycles and trends with the Hadsst3 temperature trends and the 300 mb Specific Humidity. (28,29)
Appendix - C02
The "consensus" IPCC models make the fundamental error of ignoring the long- term decline in solar activity and temperature following the Millennial Solar Activity Turning Point and activity peak which was reached in 1990/91 as shown in Figure 1 (5)The amount of CO2 in the atmosphere is .058% by weight. That is one 1,720th of the whole. It is inconceivable thermodynamically that such a tiny tail could wag so big a dog. See in particular Refs B and C
Stallinga 2020 (4) concludes: " The atmosphere is close to thermodynamic equilibrium and based on that we...…… find that the alleged greenhouse effect cannot explain the empirical data—orders of magnitude are missing. ……Henry’s Law—outgassing of oceans—easily can explain all observed phenomena.” CO2 levels follow temperature changes. CO2 is the dependent variable and there is no calculable consistent relationship between the two. The uncertainties and wide range of out-comes of model calculations of climate radiative forcing (RF) arise from the improbable basic assumption that anthropogenic CO2 is the major controller of global temperatures. Miskolczi 2014 (5) in “The greenhouse effect and the Infrared Radiative Structure of the Earth's Atmosphere “says "The stability and natural fluctuations of the global average surface temperature of the heterogeneous system are ultimately determined by the phase changes of water.”
No comments:
Post a Comment