Monday, February 18, 2013

Its the Sun stupid - The minor significance of CO2

1 The IPCC's Core Problem

The IPCC  - Al Gore based  Anthropogenic Global Warming scare has driven global  Governments' Climate and Energy Policies since the turn of the century. Hundreds of billions of dollars have been wasted on uneconomic renewable energy  and CO2 emission control schemes based on the notions  that it is both necessary and possible to control global temperatures by reducing CO2 emissions. All this vast investment is based on the simple idea that as stated in the IPCC AR4 report
"we conclude that the global mean equilibrium warming for doubling CO2, or ‘equilibrium climate sensitivity’, is likely to lie in the range 2°C to 4.5°C, with a most likely value of about 3°C. Equilibrium climate sensitivity is very likely larger than 1.5°C."
These values  can only be reached by adopting two completely unfounded and indeed illogical assumptions and procedures
1. CO2 is simply assumed to be the main climate forcing .This is clearly illogical  because at all time scales CO2 changes follow temperature changes.
2.  Positive feedback  from the other GHGs - notably water vapour and methane is then added on to the effects of CO2 and attributed to it. Obviously, in nature,  the increase in  CO2 and  Humidity  are  both caused by rising temperatures. It is also impossible to have a net positive feedback because systems with total positive feed back are not stable and simply run away to disaster. We woudn't be here to tell the tale if it were true.

From its inception the IPCCs remit was to measure Anthropogenic  Climate Change and indeed Climate Change was defined as Anthropogenic until the 2011 SREX report when the definition was changed.The climate science community simply designed their models to satisfy the political  requirements of their funding agencies. - Publications ,acadmic positions,peer approval , institutional advancement and grants were unlikely to be forthcoming unless appropriate forecasts of catastrophic warming were dutifully produced. The climate models have egregious structural errors and ,what is worse, in their estimates of  uncertainty the IPCC reports for Policymakers simply ignored this structural uncertainty and gave policy makers and the general public a totally false impression of the likely accuracy  of their temperature forecasts.It is this aspect of the AGW meme which is especially unconsionable.

The inadequacy, not to say inanity, of the climate models can be seen by simple inspection of the following Figure 2-20  from the AR4 WG1 report.


Fig1


The only natural forcing is TSI and everything else is anthropogenic. For example under natural should come such things as eg Milankovitch Orbital Cycles,Lunar related tidal effects on ocean currents,Earths geomagnetic field strength and all the Solar Activity data time series - eg Solar  Magnetic Sield strength, TSI ,SSNs ,GCRs ,( effect on aerosols,clouds and albedo) CHs, MCEs, EUV variations, and associated ozone variations and Forbush events. Unless the range and causes of natural variation are known within reasonably narrow limits it is simply not possible to calculate the effect of anthropogenic CO2 on climate.
The results of this gross error of scientific judgement is seen in the growing discrepancy between global temperature trends and the model projections. The  NOAA  SSTs show that with CO2 up 8% there has been no net warming since 1997, that ,the warming trend peaked in 2003 and that there has been a cooling trend since that time.
ftp://ftp.ncdc.noaa.gov/pub/data/anomalies/annual.ocean.90S.90N.df_1901-2000mean.dat

The gap between projections and observations  is seen  below


                                      Fig 2 ( From Prof. Jan-Erik Solheim (Oslo) )


2, The Real Climate Drivers.

Earths climate is the result of resonances between various quasicyclic processes of varying wavelengths. The long wave Milankovich eccentricity,obliquity and precessional cycles are modulated by solar "activity" cycles with millenial centennial and decadal time scales .These in turn interact with lunar cycles and endogenous earth changes in Geomagnetic Field strength ,volcanic activity and at really long time scales plate tectonic movements of the land masses.The combination of all these drivers is mediated through the great oceanic current and atmospheric pressure systems to produce the earths climate and weather.
To help forecast decadal  and annual changes we can look at eg the ENSO  PDO, AMO NAO indices and based on past patterns make reasonable forecasts for varying future periods. Currently the PDO suggests we may expect 20 - 30 years of cooling in the immediate future.Similarly for multidecadal,centenial and millennial predictions we need to know where we are relative to the appropriate solar cycles.The best proxies for solar "activity"are currently ,the Ap index, and the GCR produced neutron count .The solar indices are particularly important  for their past history these can be retrieved from the 10 Be data,
In a previous post on   htpp://climatesense-norpag.blogspot.com   on  1/22/13 - Global Cooling - Timing and Amount(NH) I have made suggestions of possible future cooling based on a repetion of the solar millenial cycle. Here I point out for the modellers the value of using the Ap index as a proxy measure of solar activity. Compare the Northern Hemisphere HADSST3 Temperature anomaly since 1910 with the AP index since 1900 . Because of the thermal inertia and slow change in the enthalpy of the oceans there is a 10 - 12 year delay between the driver proxy  and the temperature.


                                                                                         Fig 3 - From Hadley Center


                                                       Fig 4  From  http://www.leif.org/research/Ap-1844-now.png

There are some good correlations .The 1900 and 1965 Ap lows correspond to the NH  temperature minima at 1910 and 1975 respectively . The 1992 Ap peak ( Solar Cycle 22)  corresponds to the 2003 temperature high and trend roll over- and as shown in the previous post referred to above might well represent  the roll over of the millenial solar cycle which brought the Medieval and Roman warming peaks. The NH is used because it is more sensitive to forcing changes and its greater variability makes correlation more obvious.
As a simple conceptual model the Ap index can be thought of as simple proxy for hours of sunshine especially when mentally integrated over a 10 -12 year period.  See Wang et al
 http://www.atmos-chem-phys.net/12/9581/2012/acp-12-9581-2012.pdf

As far as the future is concerned the Solar Cycle  23/24 Ap minimum in end 2009 is as low as the 1900 minimum and would suggest both a secular change in solar activity in about 2006 and a coming temperature minimum at about 2019/20. This change is also documented for TSI by  Adbussamatov  2012 http://www.ccsenet.org/journal/index.php/apr/article/view/14754


                                                                                             Fig 5.


As a final example for this post  the following figure from Steinhilber et al http://www.pnas.org/content/early/2012/03/30/1118965109.full.pdf
shows the close correlation of successive Little Ice Age Minima with cosmic Ray intensity.


                                                                                                    Fig 6

CONCLUSION :    IT IS NOW CLEAR THAT THE Ap/GCR/10BE DATA ARE THE BEST PROXY MEASURES OF
THE EARTHS TEMPERATURE DRIVER OVER MILLENIAL CENTENNIAL AND DECADAL TIME SCALES.
THE BEST WAY OF FORECASTING THE FUTURE IS TO PREDICT FUTURE SOLAR CYCLES AT THESE WAVELENGTHS KEEPING IN MIND THE EARTHS MAGNETIC FIELD STRENGTH AND OBLIQUITY TRENDS OVER LONGER TIME PERIODS.


3. The Response of the  Modellers ,IPCC and Political Alarmists.
 
The modelling community and the IPCC have both recognised that they have a problem. For example both Hansen and Trenberth have been looking for the missing heat and generating epicycle type theories to preserve their models.Hansen thinks it might have something to do with aerosols and Trenberth first wanted to hide it down the deep ocean black hole. Death Train Hansen is a lost cause as far as objective science is concerned but Trenberth has always been a more objective and judicious scientist and has recently made excellent  progress in discovering a real negative feedback in the system. see
http://www.cpc.ncep.noaa.gov/products/outreach/proceedings/cdw31_proceedings/S6_05_Kevin_Trenberth_NCAR.ppt
 
He says


This is an encouraging start and its inclusion would improve models significantly. Clearly it would reduce very substantially the currently IPCC calculated temperature sensitivity to CO2 . He now also needs to add into the models the iris effect of the GCR modulation  of the global incoming radiation flux via clouds ,possibly related natural aerosols, and resulting  albedo changes on global temperatures.When this is done the sensitivity to doubling  CO2 will be 1 degree or less similar to  separate calculations by Lindzen, Spencer and Bjornbom
http://hockeyschtick.blogspot.com/2013/01/new-paper-confirms-findings-of-lindzen.html

The IPCC 's response to the lack of warming is seen in the SREX  2011 report. they say

“Uncertainty in the sign of projected changes in climate extremes over the coming two to three decades is relatively large because climate change signals are expected to be relatively small compared to natural climate variability”.

In other words they realised  that they could no longer scaremonger on the basis of the trend and so in that report and in the forthcoming AR5 they have chosen to concentrate on "extreme" events to promote their scaremongering anti CO2 policy agenda  while keeping unchanged their climate sensitivity calculations.The core alarmists  Hansen, Mann, McKibben and Romm and their MSM ,Celebrity and Political  acolytes including Obama are simply following the IPCC script with their ever more hysterical predictions of future extreme disasters as the current earth obstinately refuses to warm up.
The AR5 Summary for Policymakers is currently in draft form.Obviously Trenberth and his associated modellers cannot restructure the models in time to change the science section but perhaps they could at least insist that the final report makes proper allowance for the structural uncertainty in the model outcomes .

CONCLUSION 
 TRENBERTH'S LATEST WORK IMPLIES THAT WHEN IT IS INCORPORATED INTO THE CLIMATE MODELS THE ENTIRE CAGW  SCARE WILL COLLAPSE.
The only effect of increasing CO2 will be to ameliorate slightly the coming cold  temperature trend and to help world food production by its fertilizing effect on crops.


Tuesday, January 22, 2013

Global Cooling - Timing and Amount.(NH)

1 Wisdom ( Paraphrased)  From The Master.  ( http://www.sirbacon.org/links/4idols.htm )

"In the Novum Organum (the new instrumentality for the acquisition of knowledge) Francis Bacon classified the intellectual fallacies of his time under four headings which he called idols. The fourth of these were described as :

Idols of the Theater are those which are due to sophistry and false learning. These idols are built up in the field of theology, philosophy, and science, and because they are defended by learned groups are accepted without question by the masses. When false philosophies have been cultivated and have attained a wide sphere of dominion in the world of the intellect they are no longer questioned. False superstructures are raised on false foundations, and in the end systems barren of merit parade their grandeur on the stage of the world."

Climate science has been particularly prone to this fourth type of idol- although it is not the only branch of science so affected. Cosmology may well have fallen into the same error - but that is a whole other subject.

2.Very Unreliable Climate Forecasts - Modelling.

The entire IPCC - Al Gore CAGW paradigm relies on the forecast of dangerous 21st century warming based on the projections (not, modellers are careful to say,predictions) of climate models. The outcome of models is not empirical data .The science is in the inputs i.e our knowledge ( often guesses and assumptions ) of the initial conditions and the physical processes at work on the initial state of the system as we can best establish it.
 Science section  IPCC AR4 WG1 8.6 deals with forcings, feedbacks and climate sensitivity. The conclusions are in section 8.6.4 which deals with the reliability of the projections.It concludes:

"Moreover it is not yet clear which tests are critical for constraining the future projections,consequently a set of model metrics that might be used to narrow the range of plausible climate change feedbacks and climate sensitivity has yet to be developed"
What could be clearer. The IPCC  in 2007 said that we dont even know what metrics to put into the models to test their reliability.- ie we don't know what future temperatures will be and we can't calculate the climate sensitivity to CO2.This also begs a further question of what mere assumptions went into the "plausible" models to be tested anyway.
This quoted statement was ignored by the editors who produced the Summary for Policymakers. Here predictions of disaster were illegitimately given “with high confidence.” in complete contradiction to several sections of the WG1 science section where uncertainties and error bars were discussed. Almost all the worlds politicians, media and eco-activist organisations   uncritically  accepted and used these predictions as infallible guides to the futrure and acted on these delusions of certainty.

A glance at this Figure 2-20 From AR4 WGI shows immediately that the IPCC  models are structurally obviously highly  implausible. The only natural forcing is TSI  and everything else is anthropogenic. For example under natural should come such things as eg Milankovitch orbital cycles,Lunar related tidal effects on ocean currents  and all the Solar activity  data time series - eg Solar and Earth magnetic field strength, TSI ,SSNs ,GCRs ,( effect on aerosols,clouds and albedo) CHs, MCEs, EUV variations,  and associated ozone variations and Forbush events. Unless  the range and causes of natural variation are known within reasonably narrow limits it is simply not possible to calculate the effect of anthropogenic CO2 on climate.


Has the situation improved in the upcoming AR5 report? Apparently not . AR5 Chapter 9 which asesses the capabilities of the climate models concludes;
"Although future climate projections cannot be directly evaluated,climate models are based on verifiable physical principles and are able to reproduce many important aspects of past response to external forcing. In this way, they provide a scientifically sound preview of the climate to come."
Based on the words in bold the last sentence is logically absurd.In fact after a further five years of modelling the uncertainty of the 2100 temperature prediction is  larger for AR5 than  for AR4 and the AR4 predictions themselves are clearly failing as shown in Fig 1 on a previous post on this site -  Global Cooling Climate and Weather forecasting. See it also at
 http://wattsupwiththat.com/2012/11/19/cooling-in-the-near-future/#more-74502

The structural and scenario uncertainties  of the models are so large that all the efforts spent on modelling represent a sad waste of human,computing  and financial resources. In addition the modellers have been very remiss in allowing the IPCC Summaries for Policymakers to get away with enormously under-reporting the structural uncertainty of their predictions (projections) and thereby scaring  policy makers into adopting, and the public in many countries into accepting policies and taking actions to control emissions which are likely to prove to have been  entirely unnecessary and enormously economically harmful to the worlds population.

3. Less Unreliable Climate Forecasts-  the Baconian empirical inductive approach.

In the last 200  years enormous amounts of data have been collected on global temperatures both from instuments and in the last 35 years in particular from various temperature proxies. A similarly impressive  data base now exists on measurements of  proxies of the various possible climate drivers - both exogenous and endogenous to the earth,. Considerable effort has been put into the statistical anaylsis of all these data in order to distinguish cause from effect  and identify trends and periodicities in both sets of data and correlate one with the other with  a view to forecasting future trends.
In order to make an informed judgement it is sine qua non   for the seriously interested non scientist  - eg politicians especially Presidents and Prime Ministers, ,media editors and TV producers  or professional NGO environmentalists  to have some familiarity  with  both the general priniples involved and also with  the actual data as opposed to the opinions of some percieved authority  either individual - eg Al Gore  or institutional - the IPCC.

As to the principles, the main problem lies in distinguishing signal from noise in the various time series and correlating the signals.I recommend Nate Silvers new book. "The Signal and the Noise - why so many predictions fail but some don't"  Penguin NY. 2012  -  see especially chapter 12 on -  A Climate of Healthy Skepticism.
As an aside -  it is worth noting that the transformation of the estimated size of the USA's accessible energy resources and the regeneration of its econmy which will surely follow unless the greens and politicians get in the way ,has as its source the truly astounding  improvement in the signal to noise ratio in the interpretation of seismic data by the oil industry.
Some of the main statistical analytical techniques  and  proxy time series  of temperature and climate drivers used in climate research are clearly  explained in the 2nd edition of William James Burroughs   - "Weather Cycles -Real or Imaginary? "  Cambridge University Press 2003.
 As for the data - seriously interested parties should take the time necessary to become familiar with the general trends in both the instrumental and proxy time series of temperature ,forcings and feedbacks.
Links to some key data sources were provided in the earlier post referred to above.Look also at the three Bogard contributions at  http://www.therightclimatestuff.com/StudiesReports.html
Central  to any forecast of future cooling is some knowledge of the most important reconstructions of past temperatures.
Serious partipants in the climate debate should at least read the conclusions of and look at the figures in some key papers to get a general sense of what the data base shows.
Here are links to some of the most relevant papers.

http://stephenschneider.stanford.edu/Publications/PDF_Papers/MannBradleyHughes1998.pdf
http://www.ncdc.noaa.gov/paleo/pubs/mann_99.html
 note Espers comments on the above at
http://eas8001.eas.gatech.edu/papers/Esper_et_al_Science02.pdf
and see how Mann's hockey stick has changed in later publications
http://www.pnas.org/content/105/36/13252.full
http://www.meteo.psu.edu/holocene/public_html/shared/articles/MannetalScience09.pdf
an important paper by Berggren et al relating solar activity to climate is
http://www.eawag.ch/forschung/surf/publikationen/2009/2009_berggren.pdf
and another showing clearly the correlation of the various climate minima over the last 1000 years to cosmic ray intensities -( note especially Fig 3C ,D below  ) is: Steinhilber et al - 9400 years of cosmic radiation and solar activity from ice cores and tree rings:
http://www.pnas.org/content/early/2012/03/30/1118965109.full.pdf
for Holocene climate variability in general there is much food for thought in Mayewski et al :
http://yly-mac.gps.caltech.edu/AGU/AGU_2008/Zz_Others/Li_agu08/Mayewski2004.pdf
Of particular interest with regard to the cause of the late 20th century temperature increase is Wang et al:
http://www.atmos-chem-phys.net/12/9581/2012/acp-12-9581-2012.pdf
for an immense compendium of articles and data including a summary of projections for the future see:
www.appinsys.com/GlobalWarming


However the empirical approach too has its dangers. Bacon says

"But the Empirical school of philosophy gives birth to dogmas more deformed and monstrous than the Sophistical or Rational school. For it has its foundations not in the light of common notions, (which though it be a faint and superficial light, is yet in a manner universal, and has reference to many things,) but in the narrowness and darkness of a few experiments. To those therefore who are daily busied with these experiments, and have infected their imagination with them, such a philosophy seems probable and all but certain; to all men else incredible and vain."

Hansen and Mann have clearly fallen into this trap. Indeed , Mann acknowledges as much in the Silvers book . He says that  in order to be heard , in his policy proselytizing presentations  he plays down  the extent of the uncertainties which he finds in his professional researches .

4. Global Cooling Forecast- Timing and Amount in the NH.

Having indicated earlier  the difficulties and follies  of forecasting of all sorts.I will now jump in and take a run at the next 600 years for the Northern Hemisphere based on a considered look at a fair cross section of the scientific literature.
The conclusions and or assumptions on which this forecast is  based are as follows.

a) The earth will continue to cool from the Holocene climate optimum from  between 4-7500 years ago due to orbital insolation changes.However this cooling woudn't contribute more than about 0.05 degrees /100 years.
b) CO2 sensitivity is low. ( 1 degree or less ) CO2 rises follow temperature rises and the sensitivity equation is logarithmic.Feedbacks to CO2 increases cannot be positive otherwise we wouldn't be here to discuss it. In the last 16 years there has been no net warming with CO2 up nearly 9%.
c) We are a few years into a negative phase of the PDO - we can expect another 20 - 25 years of cooling - say  a total of +/-  0.2 degrees by about 2035.
d) Solar "activity" is the main climate driver on millenial,centennial and decadal time scales.The cosmic ray intensity is a good proxy for solar activity in general and eg clearly correlates with climate minima in Fig3 in Steinhilber et al


e) The real controlling factor  for the immediate future  is where the present  day stands relative to the approximate 1000 year solar cycle peak
f) Having looked at numerous reconstructions I suggest that that of  Christiansen and Ljungqvist 2012 is the most likely to be closest to reality. : http://www.clim-past.net/8/765/2012/cp-8-765-2012.pdf   


Discussion.
The key working hypothesis  is that the solar cycle from 1000- 2000 may  repeat and we may see a pattern of temperatures from 2000 - 3000 which is similar to that from 1000 - 2000. Fig.5 from the Christiansen paper is shown above.The solid lines are the 50 year moving averages and the dashed red lines are the upper and lower quantiles.
Inspection of  Figure 5   - both the moving average and the annual data suggests the following.

1) The millennial peak is sharp  - perhaps 18 years +/-. We have now had 16 years since 1997 with no net warming - and so might expect a sharp drop in a year or two - 2014/16 -with a net cooling by 2035 of about 0.35.Within that time frame however there could well be some exceptional  years with NH temperatures +/- 0.25 degrees colder than that.
2) The cooling gradient might be  fairly steep down to the Oort minimum equivalent which would occur about 2100. (about 1100 on Fig 5) with a total cooling in 2100 from the present estimated at  about 1.2 +/-
3) From 2100 on through the Wolf and Sporer minima equivalents with intervening highs to the Maunder Minimum equivalent which could occur from about 2600 - 2700 a further net cooling of  about 0.7 degrees could occur for a total drop of 1.9 +/- degrees
4)The time frame for the significant cooling  in  2014 - 16  is strengthened by recent developments already seen in solar activity. With a time lag of about 12 years between the solar driver proxy and climate -see:
http://adsabs.harvard.edu/full/2005ESASP.560...19U  we should see the effects of the sharp drop in the Ap Index which took place in 2004/5 in 2016-17. This estimate is quite independent from the estimate made from Fig5.


Conclusions1) It seems reasonably probable  - say 60-40 that the NH will cool by about .35 degrees by 2035.
2) We should  be able to check the accuracy of this forecast by 2018 -20.
3)The forecast of a 1.2 degree drop by 2100 is little more than a mildly interesting suggestion at this time.
4)The idea of a Maunder Minimum equivalent at 2600 - 2700 is highly speculative.
5)Contrary to the  forecasts  made here, the Livingston and Penn solar data are suggesting a possible Maunder type Minimum in the near future.Given our ignorance of  solar physics this is entirely possible. In this  case a much more rapid cooling would occur with very serious consequences to the global food supply and the world economy.
6) Global cooling will take place concurrently with that of the NH but because of the great extent of the southern oceans the global cooling will be significantly less - maybe +/- 50 % and there will also be considerable regional variability. in both hemispheres.
7) There is no reason to expect damaging global warming.Cooling is  more likely .To prepare for it, all ethanol and biofuel subsidies and mandates should be abolished.Renewable energy and electric car subsidies are economically wasteful and accomplish nothing.There is no reason to control CO2 emissions, indeed some extra CO2, while having little effect on temperature, might aid farm productivity .   25% of the increased crop yields in the 20th century was due to the CO2 increase.


Monday, January 7, 2013

Global Temperature 2100 -Question and Answer

These posts are from  http://solarcycle24com.proboards.com/index.cgi?board=globalwarming&action=display&thread=95&page=57

Re: Global warming temperature predictions


« Reply #841 Yesterday at 12:04pm »

--------------------------------------------------------------------------------

Jan 5, 2013, 9:51pm, norpag wrote:Y'all might like to check out my post GlobalCooling- Climate and Weather Forecasting at

http://climatesense-norpag.blogspot.com/....nd-weather.htlm or at

http://wattsupwiththat.com/2012/11/19/cooling-in-the-near-future/#more-74502


Norpag, I enjoyed those posts. Have you made a forecast of global temperatures through the end of this century?

Link to Post - Back to Top Logged

Re: Global warming temperature predictions


« Reply #842 Yesterday at 7:51pm »

--------------------------------------------------------------------------------

duwane - I dont think we know enough to say anything really useful yet about the end of the century.Looking at the last 15 years SSTs, the PDO. the Livingston and Penn data and the high Neutron count at the last minimum I would say,something like - its more likely than not ( 60 - 40) that the NH might be .5 - 1 degree cooler by 2035.) Beyond that it depends on exactly where we now are relative to the approximate 1000 year solar cycle and also the extent of any further decline in solar magnetic field strength .
In my eyes the simplest clue will be the Neutron count at the next minimum due about 2020.
We might have some idea of where that's headed by 2018 after that there will be enough data to have a meaningful idea of 2100. In all this the level of anthropogenic GHG is more or less irrelevant for forecasting purposes because until we know the scale and causes of natural variability much better than we now do , we can't even make any useful estimate of climate sensitivity to CO2 other than to say it must be quite low otherwise we wouldn't be here to discuss it at all.


Sunday, November 18, 2012

Global Cooling - Climate and Weather Forecasting.


Introduction.

Over the last 10 years or so as new data have accumulated the general trend and likely future course of  climate change has become reasonably clear. The earth is entering a cooling phase which is likely to last about 30 years and possibly longer. The major natural factors  controlling climate change have also become obvious.Unfortunately the general public has been bombarded by the scientific and media and political establishments with anthropogenic global  warming  - anti CO2 propaganda based on the misuse and misrepresentation of already shoddy IPCC "science"   for political ,commercial and personal ends.
The IPCC climate science community  largely abandoned empirical Baconian inductive scientific principles  and  built  worthless climate models based on  unfounded assumptions designed to show that anthropogenic CO2 was the driving force behind changing climate. Most of the IPCC output is useless as a tool for predicting future climate trends and their impacts and in particular the IPCC Summaries for Policymakers can be safely ignored for practical purposes. The divergence between the IPCC Hansen projections and the observed trends is shown below.
                                                                                     
                                   Fig 1 ( From Prof. Jan-Erik Solheim (Oslo) )
Fortunately, however , the basic data is now easily available so that any reasonably intelligent person can check on line daily or monthly to see what the incoming empirical data actually is and draw ones own conclusions.Here's how to do it in a few simple steps. I have put  in CAPITALS the main empirical observations on which one can draw conclusions re climate change ,its causes and future trends and also get a good idea of weather patterns and trends for the next year or so.

1. Check the Temperature Trends and Data.

Because of the Urban Heat Island effect ,the built in local variability of the NH land data and the thermal inertia of the oceans, Sea Surface Temperatures are the best measure of global temperature trends. These show that the global warming trend ended in about 2003. THERE HAS NOW BEEN NO NET WARMING SINCE 1997 -15 YEARS WITH  CO2 RISING 8.5% WITH NO GLOBAL TEMPERATURE INCREASE.  SINCE 2003 THE TREND IS NEGATIVE.
To check the past years go to
 ftp://ftp.ncdc.noaa.gov/pub/data/anomalies/annual.ocean.90S.90N.df_1901-2000mean.dat
and for monthly updates go to.
 ftp://ftp.ncdc.noaa.gov/pub/data/anomalies/monthly.ocean.90S.90N.df_1901-2000mean.dat


The 2012 average NCDC SST anomaly thru Sept was .4438 versus the 1997 annual anomaly of  .4575.
The peak anomaly was .5207 in 2003.

An excellent site for reviewing all the basic temperature data is  http://www.climate4you.com/

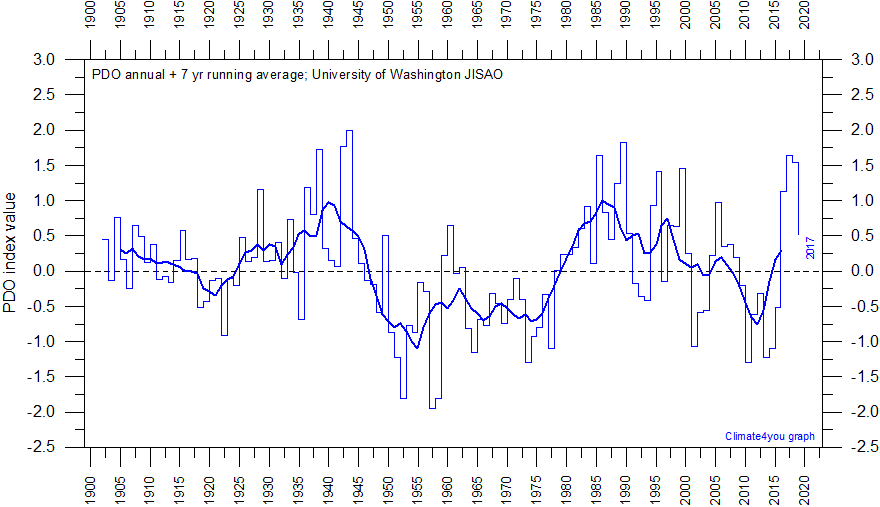
2. Check the current phase of the Pacific Decadal Oscillation.

Here  is a plot and suggested projection based on the Hadley SST3  from Tallbloke.

Fig 2


(See:  http://tallbloke.wordpress.com/2012/10/23/the-carbon-flame-war-final-comment/)  He says “I have put together a simple model which replicates sea surface temperature (which drives global lower troposphere temperature and surface temperatures a few months later). The correlation between my model and the SST is R^2=0.874 from 1876 FOR MONTHLY DATA.” The model is shown  with predictions to 2050 (blue) along with the HADsst3 (red).

I included Fig 2  because an approximate 60 year cycle is obvious by inspection and this coincides well with the  30 year +/- positive (warm) and  30year +/ negative (cold) phases of the Pacific Decadal Oscillation.  Figure 2 shows warming from about 1910 -  1940-45  , cooling from then to about 1975 -.warming to about 2003-5 and cooling since then. Total warming during the 20th century was about 0.8 degrees C. For a complete discussion and review of the data relating the PDO to the other oceanic cycles and temperatures see
 http://myweb.wwu.edu/dbunny/pdfs/aleo-easterbrook_ch5Relationship-multidecadal-global-temps-to-oceanic-oscillations.pdf

For latest PDO data see  http://jisao.washington.edu/pdo/PDO.latest

IT IS CLEAR THAT WE ARE IN THE EARLY STAGES OF A THIRTY YEAR NEGATIVE  (COOLING ) PDO CYCLE.

Fig3    ( from http://www.climate4you.com/)


3. Check Solar Activity - where are we at?

The major ice age  climate cycles are controlled by the sun - earth orbital eccentricity,and the earth's obliquity and precession. These cycles are approximately 100,000, 41,000 and 21000 years  in length respectively and are well documented in the ice core and geological record. It is useful to keep in mind that the warmest temperatures in the current interglacial occurred about 7500+/- years ago and the GENERAL TREND IS NOW A COOLING TOWARDS THE NEXT ICE AGE.

                                Fig 4  http://colli239.fts.educ.msu.edu/1999/07/11/vostok-1999/


These long term cycles are modulated by quasi cyclic trends in solar activity  which may be decadal ,centennial or millennial in length.Of particular interest in deciding where we are with regard to the solar cycles is the approximately 1000 +/- year cycle which produced succesively the Roman Warm Period, the Dark Ages,the Medieval Warm Period, the Little Ice Age and the recent 20th century warming.

Fig 5  (From  http://www.theregister.co.uk/2012/07/10/global_warming_undermined_by_study_of_climate_change/ )


The red line shows the continuing cooling trend from the Holocene optimum and the 1000yr +/- solar cycle is clearly seen.
NOTE -  A REASONABLE CASE CAN BE MADE THAT THE WARMING PEAKS OF A 60 YEAR  PDO CYCLE AND THE 1000 YEAR SOLAR CYCLE COINCIDED AT 2000 +/- AND WE ARE LIKELY ON THE COOLING SLOPE OF BOTH.
The clearest empirical measure of  solar activity is the solar magnetic field strength. On an empirical basis Livingston and Penn have shown that the decline in solar magnetic field strength suggests that sunspots could disappear by about 2015 signalling THE START OF A NEW  MAUNDER MINIMUM WITH SIGNIFICANT COOLING.
For a semi-empirical estimate of the possible cooling if a Maunder Minimum does develop see http://pubs.giss.nasa.gov/docs/2001/2001_Shindell_etal_1.pdf

Note the abstract of the Shindell  paper (Mann is one of the et als) says  "THIS LEADS TO COLDER TEMPERATURES OVER THE NORTHERN HEMISPHERE CONTINENTS ESPECIALLY IN WINTER (1 to 2 C), IN AGREEMENT WITH HISTORICAL RECORDS AND PROXY DATA FOR SURFACE TEMPEERATURES

 "For a good review of the latest sunspot and magnetic data see
http://wattsupwiththat.com/2012/09/03/the-sun-still-slumping/     and to keep  with the decline in solar magnetic field strength  and the liklihood of a Maunder Minimum  check  monthly the Livingston and Penn thread at
http://solarcycle24com.proboards.com/index.cgi?board=general&action=display&thread=855

Perhaps the best indicator of the effect of the declining solar magnetic field can be seen in the Galactic Cosmic Ray flux.
This can be checked on a daily basis at http://cosmicrays.oulu.fi/#database

Fig 6 Neutron count since 1964 from the Oulu data base.


 The Dec 2009 neutron maximum  ( solar cycle 23 -24  minimum) is greater than anything seen previously and the neutron count is now (Nov 2012) higher than at any comparable time in previous cycles since we are only 12 -18 months away from the cycle 24 solar maximum.There was a secular change in solar magnetism in 2005 - check the WUWT link posted earlier. The neutron count ties to earths climate via cloud cover and albedo. Simply put -  the lower the neutron count the lower the cloud cover  and the warmer the temperature. Because  of the enthalpy and thermal inertia of the oceans there is  a 10 - 12 year lag between the neutron troughs  and global SSTs. The short term  temperature record is variable over shorter times than 12 years because of El Ninos and  La Ninas  and volcanic and lunar effects but  the increasingly lower counts on the three troughs from 1970 -  1991 are well matched by the temperature rise from 1981 - 2003. THE RELATIVELY HIGH NEUTRON COUNT IN 2012 COMPARED WITH 1970 SUGGESTS THAT BY 2024 GLOBAL TEMPERATURES WILL BE BELOW THOSE OF 1970 WHICH WERE ALREADY BELOW 2012  BY ABOUT 0.36 C.
4. Check the Southern Oscillation Index.
Having checked the PDO a look at the SOI  will give  a shorter term look at climate and weather trends over a three or - five year period and a good idea of climate and  related weather  over the next six - 12 months.On a global scale, during El Ninos temperatures are warmer and during La Ninas temperatures are colder. El Ninos are more common during the positve phase of the PDO and La Ninas are more frequent during the negative or cold phase of the PDO. Here is where we are now.(Nov 2012)

                                  Fig 7  http://www.bom.gov.au/climate/enso/

In Fig 7 values above +8 indicate La Ninas, values below -8 are El Ninos and values in betwen are neutral or La Nadas.
 Figure 7  also has some predictive value relative to global temperatures. ( Mclean et al JGR 2009)  Global temperatures appear to lag the SOI by about 7 months.


5. Climate , Weather  and Extreme Events.

Sections 1 - 4 above show that the earth has entered a cooling trend which will continue for at least 30 years and perhaps longer. To get some idea of possible extreme weather events we might look at extremes found between the MWP and the Little Ice Age. It is unlikely however that any future extremes will be "unprecedented".There is a large literature on this topic which interested parties can consult.Some general empirical observations can be made.
On a cooling earth there is a steeper temperature gradient from the Tropics to the Poles. This produces instabilities with the jet stream swinging meridionally further south and north. Thus blocking  high pressure systems develop with extremes  of cold and heat and sharp temperature gradients between air masses with for example Sandy type blizzards or tornado swarms. A cooler world will be a generally drier world with increasing droughts globally and  in e.g the USA corn belt and in the USA in general When combined with shorter growing seasons and possible early and late frosts this is likely to threaten world food production as population increases.
The PDO and SOI  indices are the main ocean climate and weather indicators.Obviously ,for regional analyses at particular times, the phases  of other ocean systems relative to the first two -  for the U.S for example  the AMO and NAO need to be considered. These are easily checked by looking from time to time at the work of the best climate and weather  interpreters Joe D'Aleo and Joe Bastardi on http://www.icecap.us/ 


6.Summary of some Future Trends and Policy Suggestions.

The empirical observations highlighted in CAPITALS above indicate that the global warming  temperature  trend has peaked .The peak is broad with only a little cooling to date but this will likely accelerate from 2015 or 2016 on reflecting the beginning of the increase  in the cosmic ray count already seen   from 2004  - 2009 in Fig 6. The cooling will last until 2030- 2040. Often the signal for a climate direction change is a see saw effect between Arctic and Antarctic sea ice. The Arctic is still reflecting the peak in the warming  trend with low summer ice values.
The first indication of a cooling event is however the increase in Antarctic sea ice which has already occurred.
This alters the oceanic deep water circulation patterns and spreads the cooling world wide. The Arctic ice will begin to catch up in a five years or so.
With a cooling world sea levels will stop rising and begin to fall  as glaciers and ice caps begin to increase and the oceans compress with cooling.Eventually the rate of CO2 increase will slow and may even reverse even if human emissions continue to rise .
Because the error bars in our rough estimates of natural temperature variations are larger than any possible
effect of  anthropogenic CO2 ( the sensitivity curve is logarithmic and there is currently no observed empirical connection between CO2 and measured global temperatures) we cannot even measure the small effect of anthropogenic CO2 .Furthermore it is simply delusional to try to control temperature by emmission caps when the warming threat is non existent. Indeed because crop production is helped by CO2 it would make more sense to increase CO2 emissions to ameliorate the deleterious effects of cooling.
The increasing  damage from extreme ( but not unprecedented ) events arises because billions of people have moved into coastal areas,deserts and semi -arid regions during a period of unusually optimum climate. We should review infrastructure and water resources in light of the climate and weather trends outlined above and make adaptive investments as necessary after cost benefit analysis.In general ,food stocks should be built up, GM seeds adapted to drought and cold should be developed.The use of ethanol from food stocks is criminal folly and all subsidies and mandates should be abolished immediately. The best way to reduce the human footprint on the planet is to reduce population growth by getting the cheapest energy and food to the maximum number of people possible . This would free billions of women from toil so that they could pursue education , and raise their standard of living . The birth rate would drop significantly if women's status were raised in this way.


Thursday, November 1, 2012

Post on Dot Earth 11/1/12 - Adaptation

Dr Norman Page Houston.

You ( Andy Revkin) say

"Pursuing wise policies on curbing greenhouse gas emissions and on boosting resilience to extreme events both make sense,"

This is not true.It is now likely that for the next 30 years at least the earth will be in a cooling trend. Anthropogenic CO2 emissions have a hardly measurable effect on global climate compared with natural variability. Check my various posts on

climatesense-norpag.blogspot.com to see the empirical basis for this viewpoint.

The IPCC now says

"“Uncertainty in the sign of projected changes in climate extremes over the coming two to three decades is relatively large because climate change signals are expected to be relatively small compared to natural climate variability”.

Unless we get the science right we will make the wrong decisions.Cooling would bring e.g.more east coast hurricanes with some accompanying blizzards,more violent and frequent tornadoes and corn belt droughts and western forest fires . Warming e.g would bring more equable weather with better crop yields but with more category 4 Gulf Coast hurricanes.

We must identify the threats from either cooling or warming correctly and make the necessary infrastructue investments based on empirical cost - benefit analysis.

Even if the climate were to warm, curbing CO2 would make little difference at enormous economic cost - especially to the worlds poor , especially if ethanol and biofuel use continue to be mandated.

Adaptation is the only sensible policy in either case .


Tuesday, October 30, 2012

Hurricane Sandy-Extreme Events and Global Cooling

By way of introduction I will repost a piece from my blog  www.climatesense-norpag.blogspot.com

"30 Year Climate Forecast -- 2 Year Update. (posted on 7/19/2012)


The original Forecast was posted on 6/18/2010. Two more years of Termperature, Ocean Current patterns, and Solar, and "weather" data have considerably confirmed and strengthened the original forecast.

In brief - NOAA - HCN - SSTs show that warming peaked in 2003 and there has now been no net warming since 1997 - 15 years with no net warming and CO2 up 8.2%. Since 2003 the global temperature trend is slightly negative. The PDO remains in its negative phase while the solar magnetic field strength continues an inexorable decline ,which is looking more and more likely to be a precursor of a Maunder type minimum. Sunspot data and the relatively high GCR count for this stage in solar cycle 24 confirm the secular change in solar activity relative to the previous century.

Meanwhile the weather patterns - particularly in the US and Europe - have been as forecast in the earlier post. I repost some relevant parts below with some of successful predictions in bold.

". A cooler world with lower SSTs usually means a dryer world. Thus droughts will be more likely in for example east Africa with possible monsoon failures in India. In California the PDO will mean less rainfall with more forest fires in the south. However in the Cascades and Northern Sierras snowpack could increase since more of the rain could occur as snow. Northern Hemisphere growing seasons will be shorter with occasional early and late frosts and drought in the US corn belt and in Asia repeats of the harsh Mongolian and Chinese winters of 2009 – 10 . In Europe cold snowy winters and cool cloudy summers will be more frequent .

There will be a steeper temperature gradient from the tropics to the poles so that violent thunderstorms with associated flooding and tornadoes will be more frequent in the USA, At the same time the jet stream will swing more sharply North – South thus local weather in the Northern hemisphere in particular will be generally more variable with occasional more northerly heat waves and more southerly unusually cold snaps. In the USA hurricanes may strike the east coast with greater frequency in summer and storm related blizzards more common in winter."

The general conclusions of the original post are confirmed"

Hurricane Sandy is a precursor of extreme events which will become more frequent as the empirically observed cooling trend accelerates  from 2014 on as solar cycle 24 winds down.It is now very clear that the generally more meridional path of the Jet Stream  on a cooling planet with the associated development of blocking highs with steep temperature and pressure gradients between the air masses is a recipe for such extreme events.The obvious climate signal is the development of  heavy snows and blizzards on the west side of this  storm.
By contrast a warming world would have a less steep temperature gradient between the tropics and the poles with a more latitudinal Jet Stream path and a more equable climate.
Another sign of cooling is  an increase in La Nina as opposed to El Nino events,.It is not perhaps merely coincidental that Sandy developed just as an El Nino event much anticipated by the AGW faithful  failed to appear. The Australian Bureau of Meteorology said on 10/29/12;

"The retreat from El Niño thresholds over the past several weeks is considered highly unusual, as September–October is typically the time when developing El Niño (or La Niña) events consolidate and mature."

Another  straw in the climate wind is the recent record extent of Antarctic sea ice. It may well be that this is one of the first signs of a major change in the climate regime as discussed recently for example by Elderfield et al      http://www.sciencemag.org/content/337/6095/704.abstract

The general relationships between climate and earth - solar orbital relationships and solar activity are becomong increasingly clear.The relation betwen Ice Ages  and earths eccenticity, obliquity and precession  are well documented while the lunar declination cycle is well represented in the earths temperature power spectrum.These orbital cycles are modulated by solar decadal,centennial and millenial cycles mainly , but not entirely,through changes in the solar magnetic field strength and its effects on the GCR flux and the effect of the latter on clouds and aerosols and earths albedo.The late 20th century warming can be easily accounted for by the increase in sunshine reaching the earth's surface  as shown by Wang et al.

Atmospheric impacts on climatic variability of surface incident solar radiation
K. Wang1, R. E. Dickinson2, M. Wild3, and S. Liang4
http://www.atmos-chem-phys-discuss.net/12/14009/2012/acpd-12-14009-2012-print.pdf

It is now clear that  anthropogenic CO2  can play only a minor role in climate change and policies to control CO2 emissions are completely irrelevant or indeed counterproductive. Hurricane Sandy does however show what may be in store and that we should consider carefully what steps need to be taken to adapt our infrastructure to more frequent extreme events and  world   food production to the likelihood of  more general cold and drought  with intermittent floods and shorter growing seasons with unseasonable frosts.

Wednesday, October 24, 2012

Post to Frontline 10/23/12

The slant of the program was to show that the decline in the public's concern about climate change was largely due to organised political activy paid for by various right wing pressure groups.This effort could not have succeded had the world warmed as predicted by the IPCC and the ecoleft environmentalists. The real earth has been in a cooling phase since about 2003.

Because of the Urban Heat Island effect and the thermal inertia of the oceans Sea Surface Temperatures are the best measure of global trends. These show that the global warming trend ended in about 2003. There has been no net warming since 1997 since when CO2 has risen 8.5% with no global temperature increase. Since 2003 the trend is negative. The current decline in the solar magnetic field strength is so marked as to suggest a possible coming Maunder Minimum (Little Ice Age) and the phase of the Pacific Decadal Oscillation suggests a likely 20 - 30 year cooling phase. For the next 30 years or so cooling is more likely than warming .Beyond that we know too little to make any actionable predictions.A colder dryer earth would,however be much more harmful to world food production than a warmer wetter one.
Any journalist or TV producer interested in the facts should have done due diligence because all the basic data is easily available on the web. Instead you rely on presenting the opinion of advocates of the competing viewpoints but continually kept emphasising the statistically ridiculous notion of a 97% consensus for AGW.
Clearly Frontline did no due diligence on this nonsense.
Lawrence Solomon said:
"This number will prove a new embarrassment to the pundits and press who use it. The number stems from a 2008 master’s thesis by student Maggie Kendall Zimmerman at the University of Illinois, under the guidance of Peter Doran, an associate professor of Earth and environmental sciences. The two researchers obtained their results by conducting a survey of 10,257 Earth scientists. The survey results must have deeply disappointed the researchers — in the end, they chose to highlight the views of a subgroup of just 77 scientists, 75 of whom thought humans contributed to climate change. The ratio 75/77 produces the 97% figure that pundits now tout."
for a full discussion see http://opinion.financialpost.com/2011/01/03/lawrence-solomon-97-cooked-stats/
There is a real need for a reputable news organisation - Frontline? to undertake a truly objective analysis of the current state of what we know about climate science - based on the empirical data and not on the political propaganda productions of the IPCC

Thursday, October 18, 2012

Post on Economist 10/18/12

The entire anthropogenic global warming meme is a mass delusion foisted on a scientifically illiterate British and Western public by a grant ,position and honour seeking sycophantic scientific establishment and by ecoleft politicians ( including Cameron ) to reward their rent seeking campaign contributors and wind farm land owning friends.


Because of the Urban Heat Island effect and the thermal inertia of the oceans Sea Surface Temperatures are the best measure of global trends. These show that the global warming trend ended in about 2003. There has been no net warming since 1997 since when CO2 has risen 8.5% with no global temperature increase. Since 2003 the trend is negative. The current decline in the solar magnetic field strength is so marked as to suggest a possible coming Maunder Minimum (Little Ice Age) and the phase of the Pacific Decadal Oscillation suggests a likely 20 - 30 year cooling phase. For the next 30 years or so cooling is more likely than warming.A colder dryer earth would be much more harmful to world food production than a warmer wetter one.

In light of the real world climate situation Britain and Europe's climate and energy policies can only be described as lunatic or criminal - probably both

Monday, August 13, 2012

Post on Dot Earth 8/13/12

There has been no net warming since1997 with CO2 up 8.5 %. The earth has been in a cooling trend since warming peaked in 2003.The IPCC in their SREX report recognised that they could no longer scaremonger on the basis of the trend and so in that report and in the forthcoming AR5 they have chosen to concentrate on "extreme" events to promote their scaremongering anti CO2 policy propaganda..Droughts are generally more common on a cooler and dryer not on a more humid wetter earth and in N America with the current cooling phase of the PDO droughts are likely to be more common for the next 20 - 30 years.On a cooling earth with the jet stream swinging more meridionally, climate is much more variable with blocking highs bringing extremes of cold and heat.
The core alarmists Hansen, Mann, McKibben and Romm and their female acolytes are simply following the IPCC script with their ever more hysterical predictions of future extreme disasters as the current earth obstinately refuses to warm up. Andy I detect that you are not entirely comfortable with these wild speculations - but cant quite bring yourself to admit that cooling is more likely than warming in the next 30 years.

Thursday, July 19, 2012

30 Year Climate Forecast -- 2 Year Update.

The original Forecast was posted on 6/18/2010. Two more years of Termperature, Ocean Current patterns, and  Solar, and "weather" data have considerably confirmed and strengthened the original forecast.
In brief  - NOAA -  HCN -  SSTs show that warming peaked in 2003 and there has now been no net warming since 1997  - 15 years with no net warming and CO2 up 8.2%. Since 2003  the global temperature trend is slightly negative. The PDO remains in its negative phase while the solar magnetic field strength continues an inexorable decline ,which is looking more and more likely to be a precursor of a Maunder type minimum. Sunspot data and the relatively high GCR count for this stage in solar cycle 24 confirm the secular change in solar activity relative to the previous century.
Meanwhile the weather patterns - particularly in the US and Europe - have been as forecast in the earlier post. I repost some relevant parts below with some of  successful predictions in bold.

".  A cooler world with lower SSTs usually means a dryer world.  Thus droughts will be more likely in for example east Africa with possible monsoon failures in India. In California the PDO will mean less rainfall with more forest fires in the south. However in the Cascades and Northern Sierras snowpack could increase since more of the rain could occur as snow. Northern Hemisphere growing seasons will be shorter with occasional early and late frosts and drought in the US corn belt and in Asia repeats of the harsh Mongolian and Chinese winters of 2009 – 10 . In Europe cold snowy winters and cool cloudy summers will be more frequent .
There will be a steeper temperature gradient from the tropics to the poles so that violent thunderstorms with associated flooding and tornadoes will be more frequent in the USA, At the same time the jet stream will swing more sharply North – South thus local weather in the Northern hemisphere in particular will be generally more variable with occasional more northerly heat waves and more southerly unusually cold snaps. In the USA hurricanes may strike the east coast with greater frequency in summer and storm related blizzards more common in winter."
 
The general conclusions of the original post are confirmed
"The most general advice is that world food production will be subject to occasional serious severe restriction because of cold and drought. The use of food crops for biofuels should be abandoned and stockpiles built up for possible lean times ahead.. Northern cities and transportation systems should prepare for more frequent heavy snow and ice storms.
There is no threat from the burning of fossil fuels for the forseeable future, indeed an increase in CO2 would positively help in feeding the burgeoning population."
 
All the recent empirical data - especially the negative phase of the PDO  and the continued decline in the Solar magnetic field strength  now ( July 2012) suggest  that once solar cycle 24 starts its decline  in 2014-15  we will see an acceleration of the current slight cooling trend and that this trend  might well last for 25 -30 years. Beyond then we do not know enough at this time to make useful predictions.